
In this article, we're going to talk about how you can get started with the Rust tracing crate.
What is Tracing?
The tracing crate and the family of crates that fall under it are designed for completely async-compatible logging.
Many if not all of the alternative solutions, like log, log4rs etc. are not completely proven to be async-friendly. Tracing solves this problem by introducing the concept of logging over a generic period rather than a specific given time period. Additionally, the tracing crates provide a powerful system for logging in your application. It is compatible with many other crates like the OpenTelemetry SDK, allowing you to also send your logs for further analysis.
Getting Started with Tracing
You can get started with tracing by installing the crate into your project:
cargo add tracing
If your program compiles to a binary (it's not a library), you will need to install a logging subscriber. tracing-subscriber is perfect for this - you can add it by running the following:
cargo add tracing-subscriber
Basic Setup with Tracing
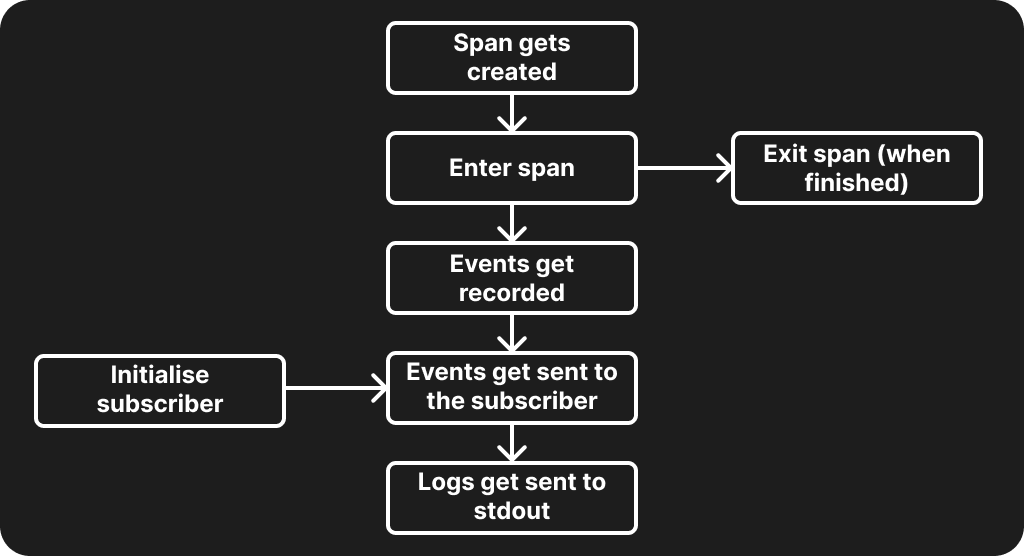
At a basic level, tracing uses the concept of spans to record the flow of program execution. Tracing uses the concept of spans which represent a generic period. The idea is that when a program performs any actions it enters a span, and when it's finished it exits the span. In comparison, other logging crates represent logging as a specific given period in time. These spans (and events that happen in them) get aggregated by a subscriber, which produces logs that the user sees as the end product.
See the diagram below:
To get started, let's initialize a tracing-subscriber with some default settings:
use tracing_subscriber::fmt::fmt;
use tracing_subscriber::filter::EnvFilter;

tracing_subscriber::registry()
    .with(fmt::layer())
    .with(EnvFilter::from_default_env())
    .init();
Note that from_default_env() will use the value of whatever the RUST_LOG environment variable has been set to. You can also create your own EnvFilter like so:
EnvFilter::builder()
    .with_default_directive(LevelFilter::ERROR.into())
    .from_env_lossy()
There are also some cases where you might want to mute all tracing from certain modules. EnvFilter lets you do this by adding directives - check out the code snippet below that limits the sqlx::migrations logging to only errors:
use tracing_subscriber::filter::EnvFilter;

let mut filter = EnvFilter::try_from_default_env()?
    .add_directive("sqlx::migrations=error".parse()?);
Interested in seeing how much you can do with filters for your subscriber? Check out this documentation page,
Working With Spans in Tracing
Once we're done setting up our tracing subscriber, we can start with logging some events. In terms of getting set up quickly, we can use tracing macros instead of manually orchestrating the spans ourselves. It's not unlike using the logging macros from the log crate and is quite simple.
fn do_something() {
  tracing::debug!("This function is doing something!");
}
5 levels of logging can be emitted: info, warn, debug, error, and trace. The similarly-named tracing macros work by setting up a span, recording an event, and then exiting the span. This is quite useful if you want to set something up quickly. However, if you're looking to dive a bit deeper you probably want to handle spans yourself:
use tracing::{event, span, Level};

// create a span with the tracing level and name of the span
let span = span!(Level::INFO, "my_span");
let _guard = span.enter();

// records an event within "my_span". A logging level is required here in the macro.
event!(Level::DEBUG, "something happened inside my_span");
Check out the table below for a cheat sheet of what attributes can be accepted by the span macro:
| Parameter | Optional? | Input type |
|---|---|---|
| Target | Yes | target = "string literal" |
| Parent span | Yes | parent = "parent span id" |
| Level | No | Any tracing::Level enum variant |
| Span name | No | "string literal" |
See the following code snippet for a created span using the macro that uses Level::DEBUG and a span description.
let span = span!(Level::DEBUG, "my_debug_span");
Like before with the various logging macros, we can use macros that generate spans with a pre-generated logging level according to the name of the macro:
let span = debug_span!("my_debug_span");
Note, however, that the documentation says that spans may produce incorrect traces if the guard is held across an await point. We can remedy this by using .in_scope() instead of entering the span itself. See below:
async fn my_async_function() {
    // constructs a span at the "info" log level
    let span = info_span!("my_async_function");

    let some_value = span.in_scope(|| {
        // run some synchronous code inside the span...
    });

    // This is okay! The span has already been exited before we reach
    // the await point.
    some_other_async_function(some_value).await;

    // ...
}
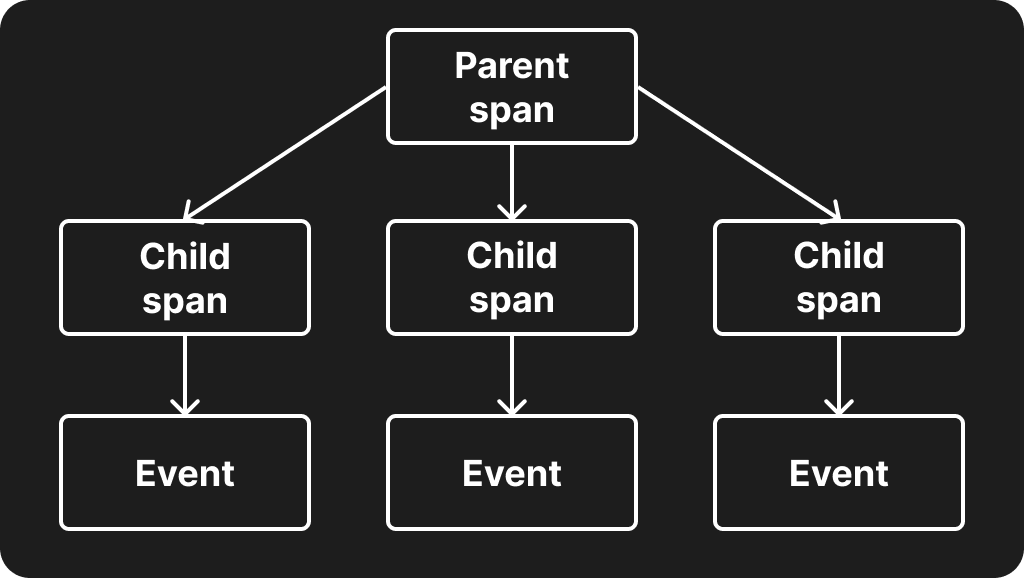
Spans can also have child-parent relationships. This means that you can also link spans to each other, as noted on this documentation page. Below is a short example of how it would work:
let span = span!(Level::INFO, "my span");
let span2 = span!(parent: &span, Level::TRACE, "span in a span");
This means you can have larger overall spans and have specific spans within those spans. An example of this might be having a span for general database events and a smaller span for record creation events. When you close the parent span, all of the child spans will also close.
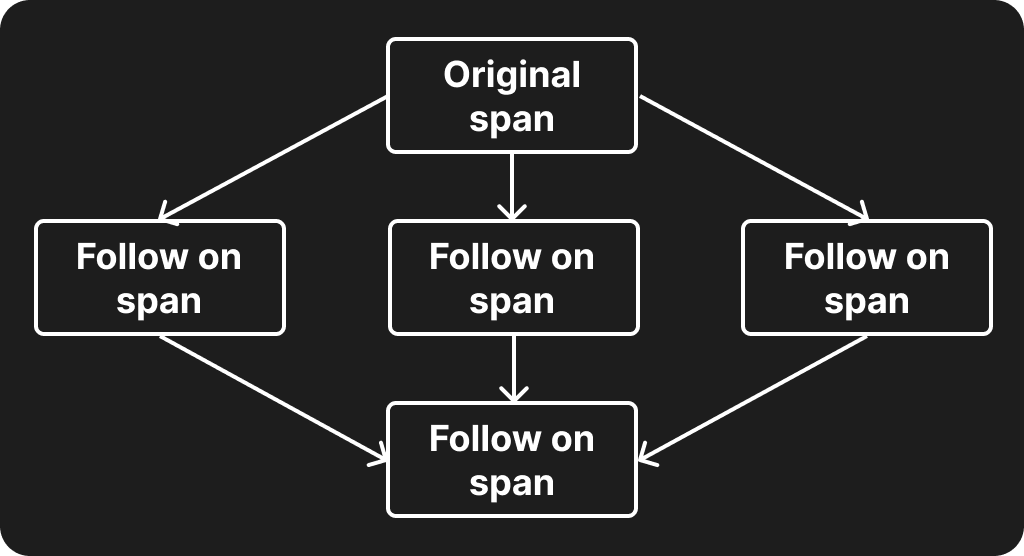
Additionally, you can also declare that a span follows on from another span:
let span1 = span!(Level::INFO, "span_1");
let span2 = span!(Level::DEBUG, "span_2");
span2.follows_from(span1);
This has the advantage of a particular span being able to follow from any number of prior spans, as well as each span being executed in its own space. You can use this to model causal relationships. In practice, this could mean a Tokio process that spawns several child processes, for example. You could have a final span that follows on from several other spans (one for each child process), and then await each process before returning and recording the final result.
Instrumentation in Tracing
Of course, having to manually add spans for every function is a bit tiring. We can instead use the #[instrument] macro from tracing to do this automatically for us. To do this, you will want to make sure the attributes feature of tracing is installed first:
cargo add tracing -F attributes
Like the span! macros previously, we can attach extra attributes to it:
#[instrument(level = "debug", target = "this_crate::some_span", name = "my_instrumented_span")]
async fn do_something_async() {
 // do some work
}
The instrument macro as above currently does the following:
- It creates a span when invoking the function at the debug level of logging.
- The name of the span is "my_instrumented_span".
- The target normally follows the
my_crate::my_moduleformat, but has been overridden to bethis_crate::some_span.
You can also add additional fields to be recorded that don't exist in the struct. The fields take Strings, integers, and boolean literals. Check out the snippet below for an example of an instrument macro that also uses some axum web service methods to get the URI and request of a method.
#[instrument(fields(http.uri = req.uri(), http.method = req.method()))]
pub fn handle_request<B>(req: http::Request<B>) -> http::Response<B> {
    // ... handle the request ...
}
There are quite a lot of attributes that the instrument macro can take. You can find more about this on the documentation page here.
Storing Logs with Tracing
We can use tracing-appender to be able to store the logs that are produced by our tracing subscriber. The tracing-appender docs front page documentation provides this code snippet for providing a non-blocking writer.
let (non_blocking, _guard) = tracing_appender::non_blocking(std::io::stdout());
tracing_subscriber::fmt()
    .with_writer(non_blocking)
    .init();
This is for a writer that writes directly to stdout. What we want is a non-blocking writer that sends the logs to a file, which is also helpfully provided by the front page documentation.
let file_appender = tracing_appender::rolling::hourly("/some/directory", "prefix.log");
let (non_blocking, _guard) = tracing_appender::non_blocking(file_appender);
tracing_subscriber::fmt()
    .with_writer(non_blocking)
    .init();
If you're interested in customizing your file log appender, you can manually invoke the RollingFileAppender builder method and then attach the methods you want to use on it:
use tracing_appender::rolling::{Rotation, RollingFileAppender};

let file_appender = RollingFileAppender::builder()
    .rotation(Rotation::DAILY) // rotate log files once per day
    .filename_prefix("mywebservice.logging") // log files will have names like "mywebservice.logging.2024-01-09"
    .build("/var/log/mywebservice") // write log files to the '/var/log/mywebservice' directory
    .expect("failed to initialize rolling file appender");

let (non_blocking, _guard) = tracing_appender::non_blocking(file_appender);
tracing_subscriber::fmt()
    .with_writer(non_blocking)
    .init();
Tracing with Other Crates
Despite tracing itself being very capable, it still requires extending to be used with other platforms - for example, OpenTelemetry or Honeycomb.io. Here are some crates you can use to beef up your tracing capabilities:
tracing-opentelemetry
Sometimes you need your logging to connect to an outside source. That's where tracing-opentelemetry comes in. By converting your tracing subscriber to use opentelemetry, you can then use one of the many crates that are supported by OpenTelemetry. This is quite useful for sending your logging to any telemetry-based app you'd like for further analysis!
To get started, you'll need to install the following packages:
cargo add opentelemetry
cargo add opentelemetry_sdk
cargo add opentelemetry_stdout
Now you can create your opentelemetry tracing layer and apply it to a subscriber:
use opentelemetry::trace::TracerProvider as _;
use opentelemetry_sdk::trace::TracerProvider;
use opentelemetry_stdout as stdout;
use tracing_subscriber::layer::SubscriberExt;

fn main() {
    // Create a new OpenTelemetry trace pipeline that prints to stdout
    let provider = TracerProvider::builder()
        .with_simple_exporter(stdout::SpanExporter::default())
        .build();
    let tracer = provider.tracer("readme_example");

    // Create a tracing layer with the configured tracer
    let telemetry = tracing_opentelemetry::layer().with_tracer(tracer);

    tracing_subscriber::registry()
    .with(fmt::layer())
    .with(telemetry)
    .init();
}
Note that tracing-opentelemetry will also allow you to use opentelemetry and opentelemetry-sdk compatible crates! You can pipe your traces to Datadog, for example, using the opentelemetry_datadog crate.
tracing-flame
Tracing can also be used to create a flamegraph! This is particularly useful if you want to find hot paths in your code or handler functions that use a particularly large amount of memory. To get started with tracing-flame, we just need to install it into our project:
cargo add tracing-flame
Now you just need to initialize it:
use std::{fs::File, io::BufWriter};
use tracing_flame::FlameLayer;
use tracing_subscriber::{registry::Registry, prelude::*, fmt};

fn main()  {
    let fmt_layer = fmt::Layer::default();

    let (flame_layer, _guard) = FlameLayer::with_file("./tracing.folded").unwrap();

    tracing_subscriber::registry()
    .with(fmt::layer())
    .with(flame_layer)
    .init();
    // ... the rest of your code
}
Once you've set your tracing subscriber up and you've started receiving traces into your tracing.folded file, you can convert it to a flamegraph by installing the inferno package:
cargo install inferno
Then you can use inferno to convert the contents of your file to a flamegraph or flamechart:
# flamegraph
cat tracing.folded | inferno-flamegraph > tracing-flamegraph.svg

# flamechart
cat tracing.folded | inferno-flamegraph --flamechart > tracing-flamechart.svg
spandoc
Interested in spawning spans from doc comments? You can with spandoc! By adding triple forward slashes and a SPANDOC: marker, you can create spans without needing to explicitly make them!
You can get started by installing spandoc into your project:
cargo add spandoc
Now you can add it to your app. Note that the function must use the spandoc macro and any events must have the Spandoc comment above it:
use spandoc::spandoc;
use tracing::info;

#[spandoc]
fn main() {
    tracing_subscriber::fmt::init();
    let local = 4;

    /// SPANDOC: Emit a tracing info event {?local}
    info!("event 1");
}
When run, this produces the following output:
INFO main::comment{local=4 text=Emit a tracing info event}: scoped: event 1
Note that there are a couple of limitations when using this crate, notably that the errors have a fixed name/target. You would ideally want to use this crate alongside other tracing crates to potentially provide more context.
Finishing Up
Thanks for reading this article! I hope you got something out of this. Getting started with the tracing crates can be intimidating, but they're very powerful when used correctly!
See more below:
- Check out this general guide for logging in Rust.
- Check out our getting started guide for Loco, the Rails on Rust framework.