Some words about observability
As we all know, being able to 'see' what's going on in our services can be critical in many ways. We can easily find bugs or identify undesired behaviors, and it's certainly an invaluable tool at our disposal.
Observability, in software, refers to the ability to understand the state of a system and its behavior by collecting, analyzing, and presenting data about its various components and interactions. This enables engineers to diagnose and resolve issues and make informed decisions about system health and performance.
Observability is critical for ensuring the reliability, scalability, and performance of modern systems, and is becoming increasingly important as software continues to play a larger role in our daily lives.
Fortunately, in the Rust ecosystem, we have Tokio Tracing which is a powerful framework for instrumenting Rust programs to collect structured, event-based diagnostic information. It provides a convenient and flexible API for collecting and viewing traces of events in your application and you can easily add context and structure to your traces, making it easier to identify bottlenecks and debug issues.
Shuttle logs
A while ago, I wrote a post about Shuttle, where I explained how ridiculously easy it is to deploy a Rust backend to the cloud by using their CLI tool.
Shuttle is still in beta, and although its observability features are not really polished yet, they offer support for Tokio Tracing and a way to view logs by using their CLI tool.
By simply running cargo shuttle logs --follow, you will be able to see something like this:
This is great for simple applications, but what if you want to send your logs to a more powerful tool like Datadog? Well, in this post, I'll show you how to do it.
Datadog
Datadog is a monitoring and observability platform that provides a single pane of glass for your infrastructure and applications. It is a cloud-based service that allows you to collect, aggregate and analyze your data, and it is extremely powerful.
As a disclaimer, I must say that I'm currently working at Datadog, so I'm a bit biased, but I'm also a huge fan of the product and I think it's a great tool for developers 😅.
Most of the time, the easiest way to send anything to the Datadog platform is by using the Datadog Agent, but in this case, as we cannot install it in any way, we will use a small library I created for the occasion called dd-tracing-layer, which happens to be using the Datadog HTTP API under the hood to send logs to the Datadog platform.
How to use tracing with Shuttle
If we check the Shuttle documentation, we can read this:
Shuttle will record anything your application writes to stdout, e.g. a tracing or log crate configured to write to stdout, or simply println!. By default, Shuttle will set up a global tracing subscriber behind the scenes.
// [...]
use tracing::info;

#[shuttle_runtime::main]
async fn axum(#[shuttle_shared_db::Postgres] pool: PgPool) -> ShuttleAxum {
    info!("Running database migration");
    pool.execute(include_str!("../schema.sql"))
        .await
        .map_err(CustomError::new)?;

    // [...]
}
So, as you can see, it seems that the Shuttle macro is already instantiating and initializing a tracing subscriber for us.
This is pretty convenient for most of the simple cases, but unfortunately, it's not enough for our purposes.
Ideally, if we had access to the underlying infrastructure, we could probably install the Datadog Agent and configure it to send our logs directly to Datadog, or even use AWS Lambda functions or Azure Event Hub + Azure Functions in case we were facing some specific cloud scenarios.
You can check the Datadog docs for log collection and integrations if you want to learn more.
Those solutions are generally great because they allow us to remove the burden of sending our logs to Datadog from our application, thus becoming the responsibility of the platform itself.
If we could do something like that with Shuttle, it would be great. But, as we just mentioned, in the case of Shuttle, we don't have access to the underlying infrastructure, so we need to find a way to send our logs to Datadog from our application.
And that's what we are going to try to do in this post.
Getting access to the subscriber
So, the basic idea is to add a new tracing layer to the subscriber which will be responsible for sending our logs to Datadog.
But for that, we'll need to get access to the subscriber instance prior to its initialization, and it turns out that Shuttle provides a way to do that just by disabling the default features on shuttle-runtime crate.
shuttle-runtime = { version = "*" default-features = false }
Creating our project
As a walkthrough, we are going to create a new Shuttle project from scratch.
The idea is to build a simple REST API using Axum and send our logs to Datadog using the dd-tracing-layer crate.
Although I'm going to describe all the steps you need to take to make this work, you can see the final state of the project in this GitHub repository.
Feel free to use it as a reference.
Initializing the project
First of all, we need to create a new Shuttle project. You can do that by using the Shuttle CLI:
cargo shuttle init --template axum
Follow the instructions and you should have a new project ready to go. I called mine shuttle-datadog-logs, but use the name you want.
Adding some dependencies
In our example, we are going to be using Shuttle Secrets, Tokio Tracing and dd-tracing-layer.
Make sure you have the following dependencies in your Cargo.toml file:
[dependencies]
axum = "0.7.4"
shuttle-axum = "0.42.0"
shuttle-runtime = { version = "0.42.0", default-features = false }
tokio = "1"
# tracing
tracing = "0.1"
tracing-subscriber = { version = "0.3", features = ["env-filter", "json", "time"] }
dd-tracing-layer = "0.1"
Instrumenting a little bit the default project
Now that we have our dependencies ready, we can start instrumenting our project a little bit.
Note that we have added the #[instrument] macro to the hello_world function and added a tracing::info! and a tracing::debug! log to it. We have also added an info log to the axum function.
// [...]
use tracing::instrument;

#[instrument]
async fn hello_world() -> &'static str {
    tracing::info!("Saying hello");
    tracing::debug!("Saying hello for debug level only");
    "Hello, world!"
}

#[shuttle_runtime::main]
async fn axum() -> shuttle_axum::ShuttleAxum {
    let router = Router::new().route("/", get(hello_world));
    tracing::info!("Starting axum service");
    Ok(router.into())
}
At this point, if you try to run the project locally by using the shuttle run command, you should see none of our logs.
That's ok, as we haven't initialized a tracing subscriber yet.
Adding our tracing subscriber
The first thing we're going to do is to add a tracing subscriber to our application.
Then we will add several layers to it:
- EnvFilter layer to set the tracing level according to a variable's value.
- Format layer to format the logs. We will be using JSON format.
- Datadog Tracing layer to send our logs to Datadog.
Apart from that, we're also going to add support for Shuttle Secrets.
Let's do it! Make sure your axum function looks like this:
use axum::{routing::get, Router};
use dd_tracing_layer::{DatadogOptions, Region};
use shuttle_runtime::SecretStore;
use tracing::instrument;
use tracing_subscriber::prelude::*;

// version of our app to be sent to Datadog
const VERSION: &'static str = "version:0.1.0";

// [...]

#[shuttle_runtime::main]
async fn axum(#[shuttle_runtime::Secrets] secret_store: SecretStore) -> shuttle_axum::ShuttleAxum {
    // getting the Datadog Key from the secrets
    let dd_api_key = secret_store
        .get("DD_API_KEY")
        .expect("DD_API_KEY not found");

    // getting the Datadog tags from the secrets
    let tags = secret_store
        .get("DD_TAGS")
        .map(|tags| format!("{},{}", tags, VERSION))
        .unwrap_or(VERSION.to_string());

    // getting the log level from the secrets and defaulting to info
    let log_level = secret_store.get("LOG_LEVEL").unwrap_or("INFO".to_string());

    // datadog tracing layer
    let dd_layer = dd_tracing_layer::create(
        DatadogOptions::new(
            // first parameter is the name of the service
            "shuttle-datadog-logs",
            // this is the Datadog API Key
            dd_api_key,
        )
        // this is the default, so it can be omitted
        .with_region(Region::US1)
        // adding some optional tags
        .with_tags(tags),
    );

    // filter layer
    let filter_layer =
        tracing_subscriber::EnvFilter::try_new(log_level).expect("failed to set log level");

    // format layer
    let fmt_layer = tracing_subscriber::fmt::layer()
        .with_ansi(true)
        .with_timer(tracing_subscriber::fmt::time::UtcTime::rfc_3339())
        .json()
        .flatten_event(true)
        .with_target(true)
        .with_span_list(true);

    // starting the tracing subscriber
    tracing_subscriber::registry()
        .with(filter_layer)
        .with(fmt_layer)
        .with(dd_layer)
        .init();

    // starting the server
    let router = Router::new().route("/", get(hello_world));
    tracing::info!("Starting axum service");
    Ok(router.into())
}
There are many things going on in this code, so take your time to go through it.
Secrets
Before running our project, there's still a thing we have to deal with: secrets.
As you can see in the code above, we are using the #[shuttle_runtime::Secrets] macro to get the Datadog API key, the tags and the log level.
Shuttle Secrets relies on having a Secrets.toml file in the root of our project containing all the secrets, and it also supports having a Secrets.dev.toml file for local development. You can learn more about this convention in the Shuttle Secrets documentation.
So, let's create two files in the root of our project:
Secrets.dev.toml
DD_API_KEY = "your-datadog-api-key"
DD_TAGS = "env:dev,service:shuttle-datadog-logs"
# setting info as the default log level, but debug for our project
LOG_LEVEL = "INFO,shuttle_datadog_logs=DEBUG"
and Secrets.toml
DD_API_KEY = "your-datadog-api-key"
DD_TAGS = "env:prod,service:shuttle-datadog-logs"
LOG_LEVEL = "INFO"
Remember to add these files to your
.gitignorefile!
Running the project
Now, run cargo shuttle run and go to http://localhost:8000 in your browser to see our "Hello, world!" message.
Alternatively, you can also use curl to test the endpoint:
curl -i http://localhost:8000
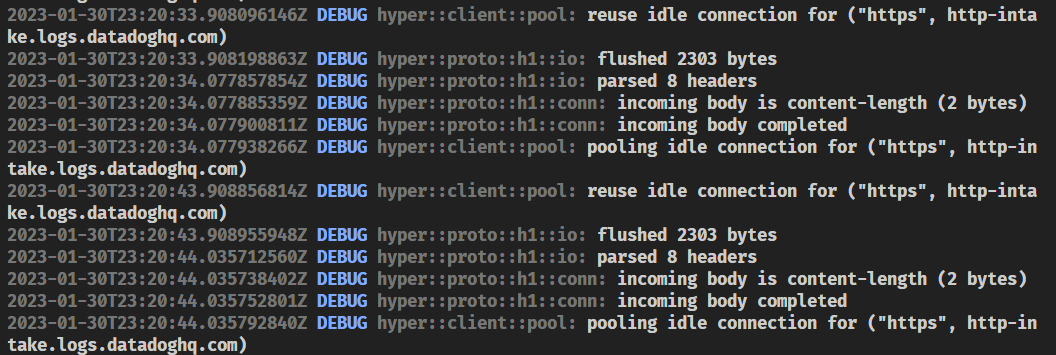
You should be able to see the logs in your terminal now.
But remember... this endpoint was instrumented! So, if everything went well, we should be able to see the logs in Datadog.
Let's check it out! 👀
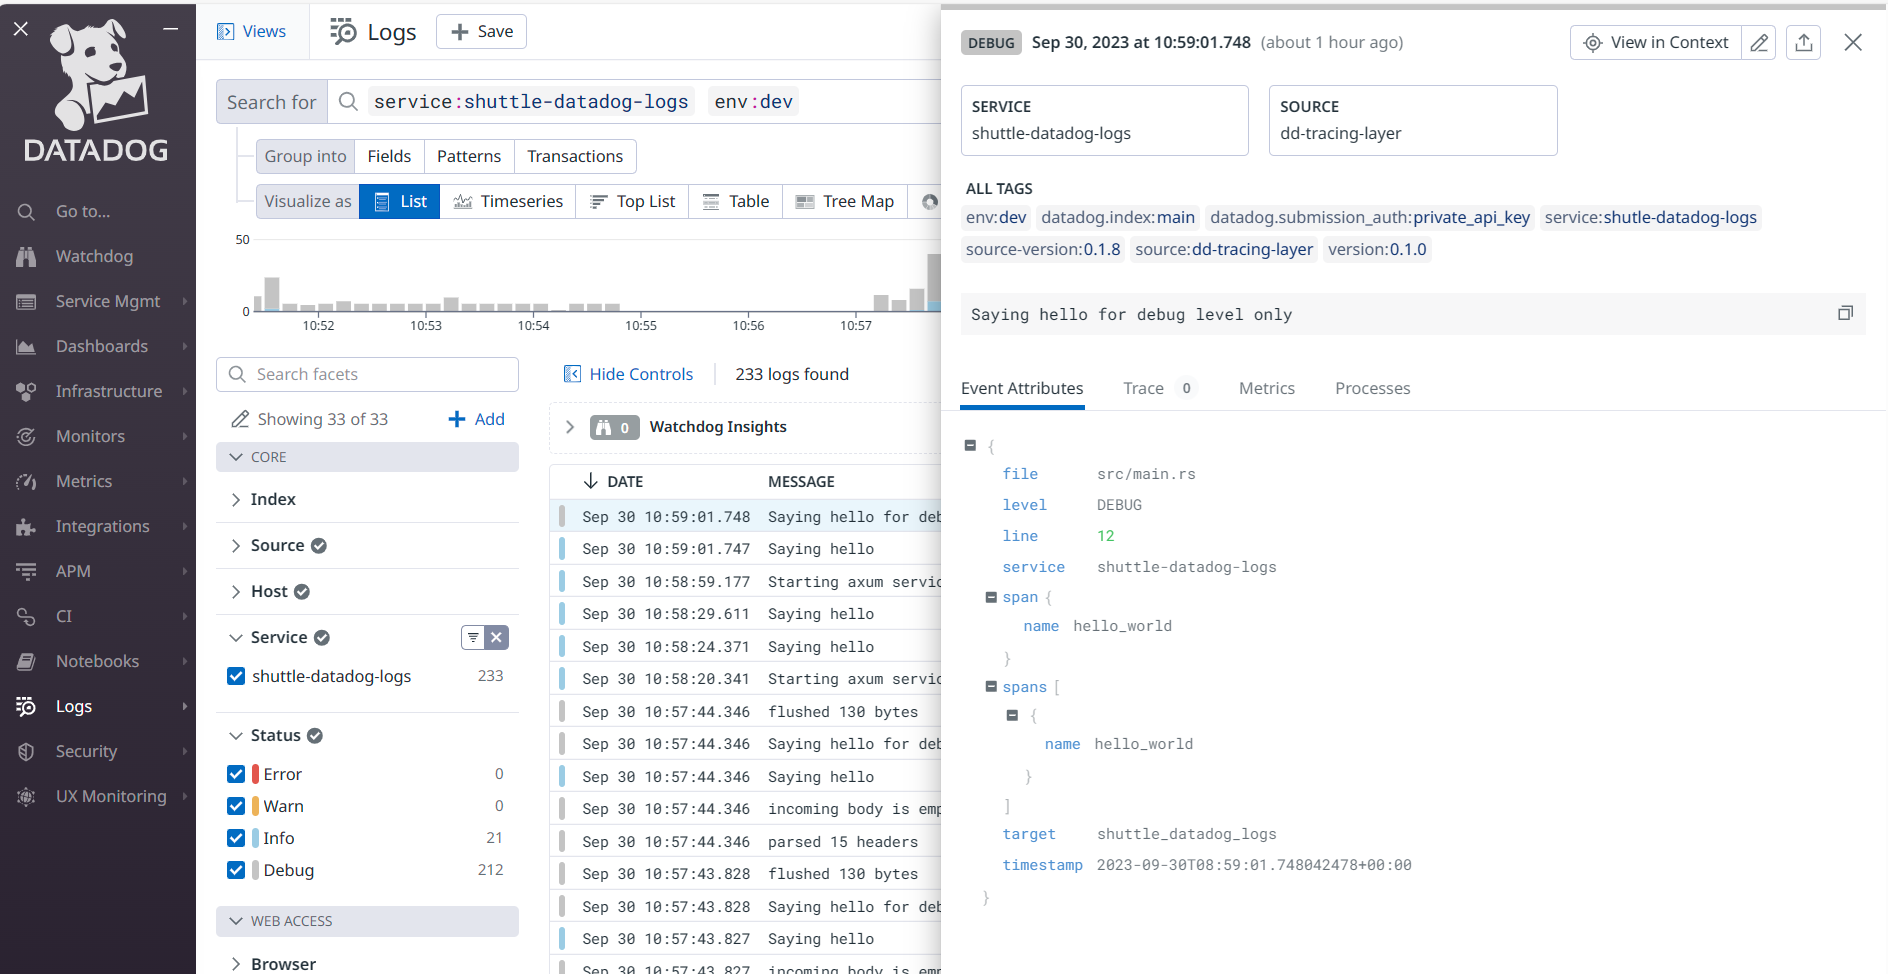
It works! 🎉
Conclusion
As you can see, it's pretty easy to send your logs to Datadog from your Shuttle powered backend.
Again, you can see the full code in this GitHub repository.
I hope you've enjoyed it! 😁